

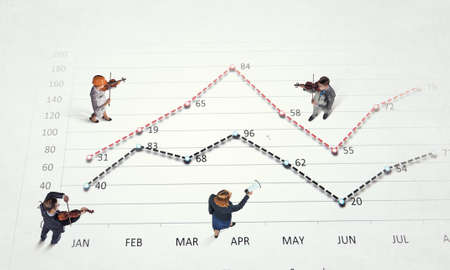
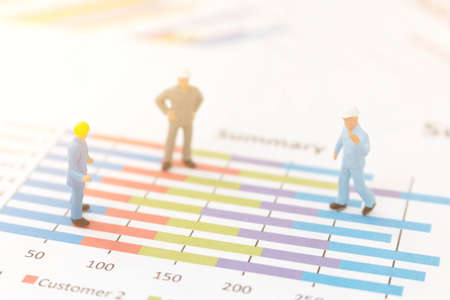
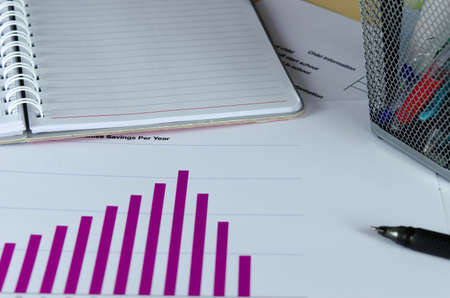
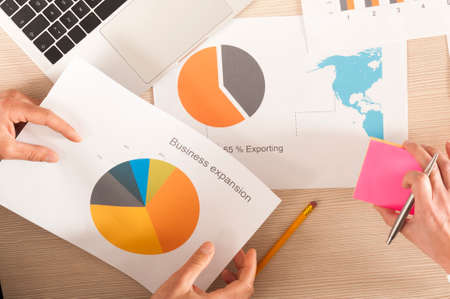
Businessmen miniature figure standing on investment and profit graph for analysis and discussion.
Коллекция по умолчанию
Коллекция по умолчанию
Создать новую
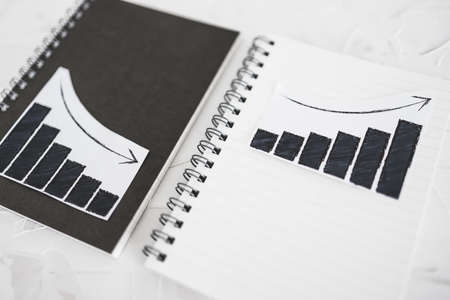
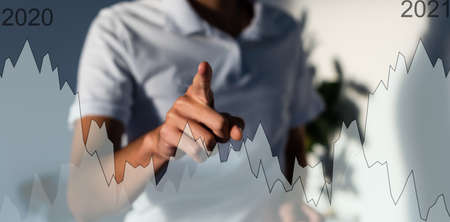
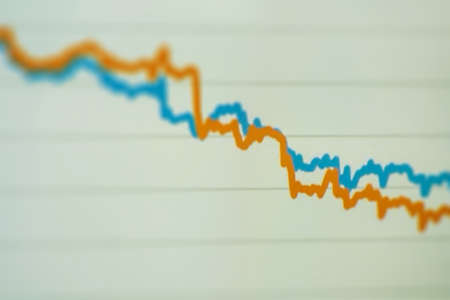
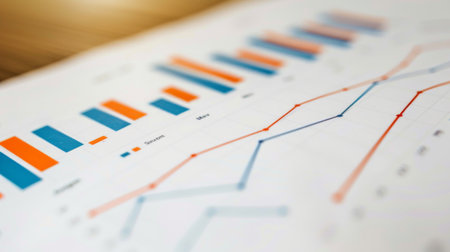
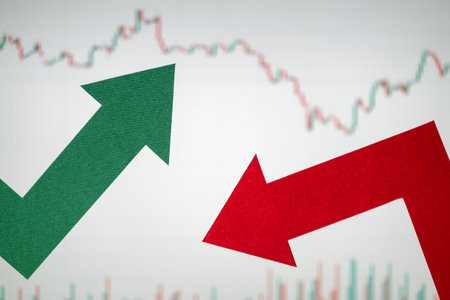
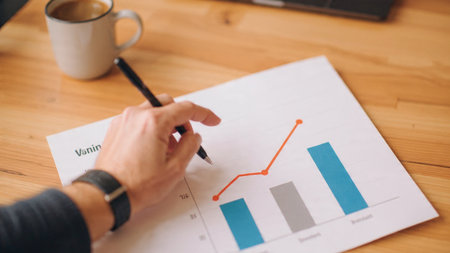
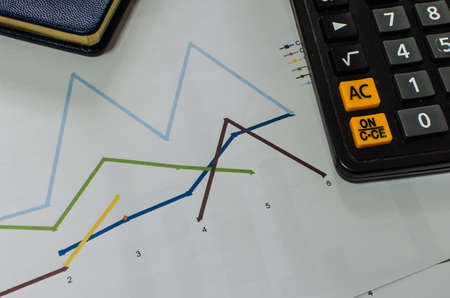
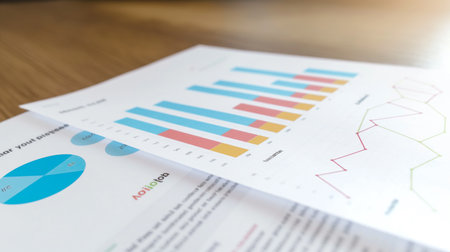
business analysis and statistics concept, positive and negative trends on graphs on notebooks side by side
Коллекция по умолчанию
Коллекция по умолчанию
Создать новую

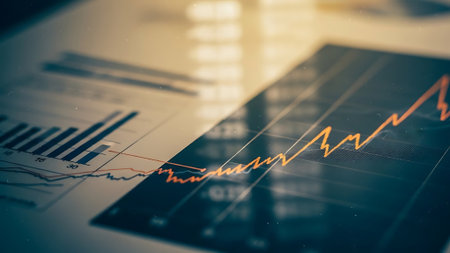
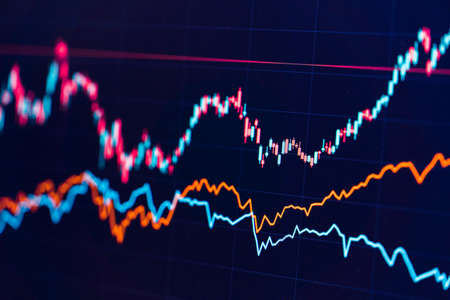
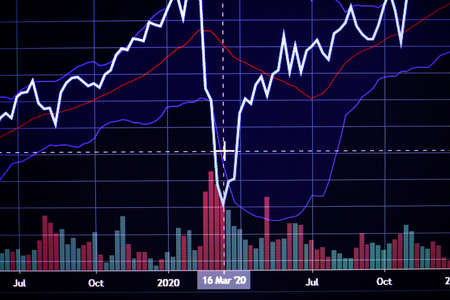
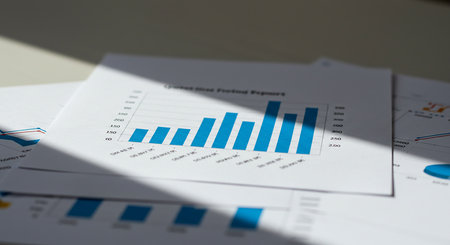
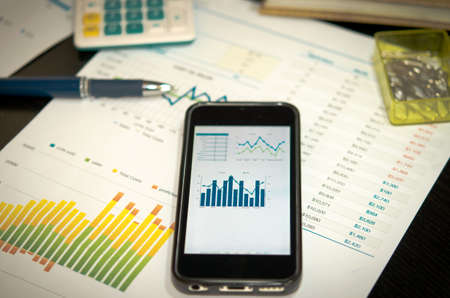
Shallow depth of field (selective focus) with details of a chart showing the stock market crash from March 2020 due to the Covid-19 pandemic on a computer screen (S&P500 index)
Коллекция по умолчанию
Коллекция по умолчанию
Создать новую

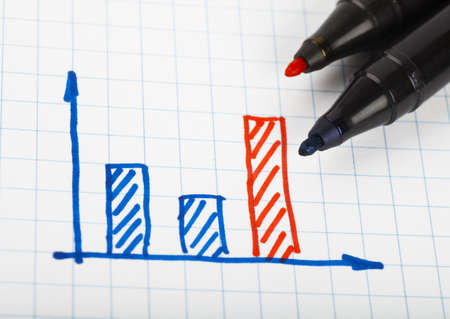
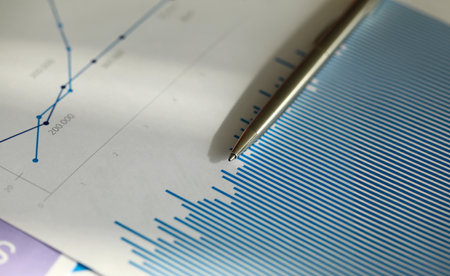
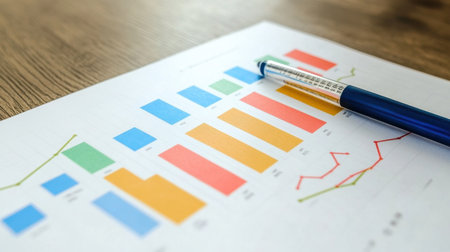
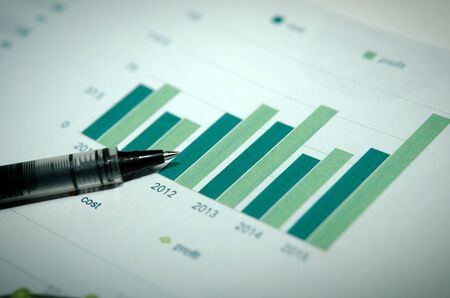
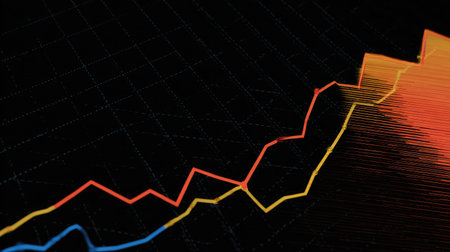
business graph with pen
Коллекция по умолчанию
Коллекция по умолчанию
Создать новую

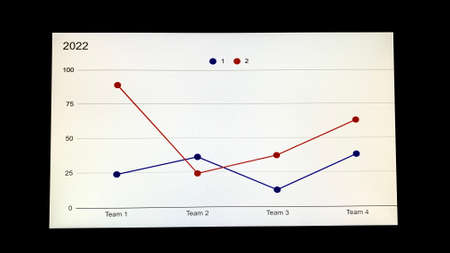
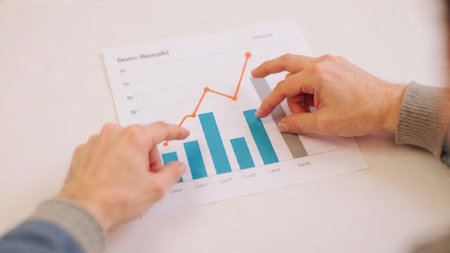
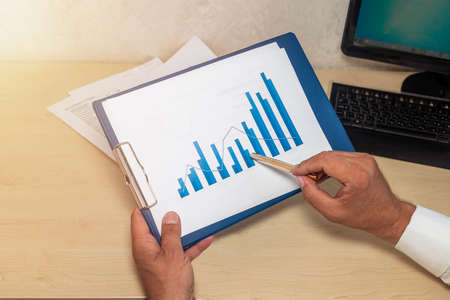
Team work with results and reports
Коллекция по умолчанию
Коллекция по умолчанию
Создать новую
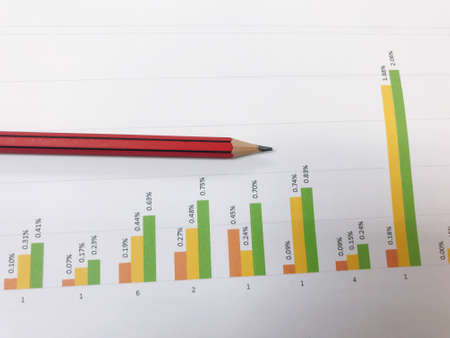
Monthly percentage bar chart showing financial comparison of 2026 budget versus actual performance data displayed on digital screen. Results tracking.
Коллекция по умолчанию
Коллекция по умолчанию
Создать новую
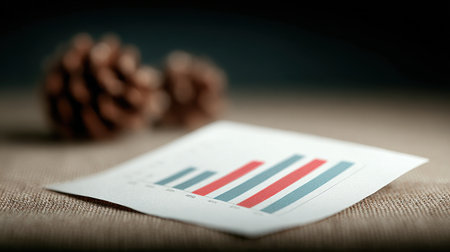
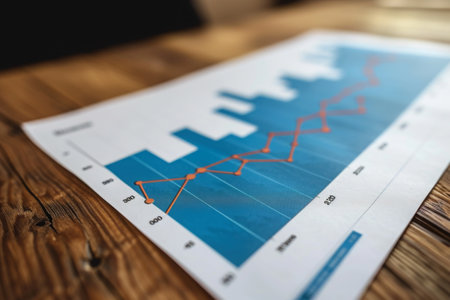
A piece of paper with a graph on it is on a table. The graph is a bar chart with a red and blue line. The paper is crumpled and has a few creases
Коллекция по умолчанию
Коллекция по умолчанию
Создать новую
Stock market business graph chart on digital screen
Коллекция по умолчанию
Коллекция по умолчанию
Создать новую

Abstract candlestick chart on white digital screen. Stock market or crypto data chart, graph with rectangular grid on light background.
Коллекция по умолчанию
Коллекция по умолчанию
Создать новую

Virus pandemic covid-19 map on pc screen, global infection, internet.
Коллекция по умолчанию
Коллекция по умолчанию
Создать новую

Business chart with line graph, bar chart and numbers on dark background, 3d rendering. Computer digital drawing.
Коллекция по умолчанию
Коллекция по умолчанию
Создать новую

Graph of market share with black pen in business concept
Коллекция по умолчанию
Коллекция по умолчанию
Создать новую

Many type of infographic diagram over white background. Top view.
Коллекция по умолчанию
Коллекция по умолчанию
Создать новую

Analysis of data from graphs. select focus.
Коллекция по умолчанию
Коллекция по умолчанию
Создать новую

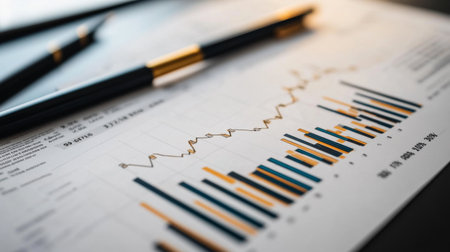
Close-up of a stock market analysis chart with a mix of bar graphs and line graphs highlighting key data
Коллекция по умолчанию
Коллекция по умолчанию
Создать новую
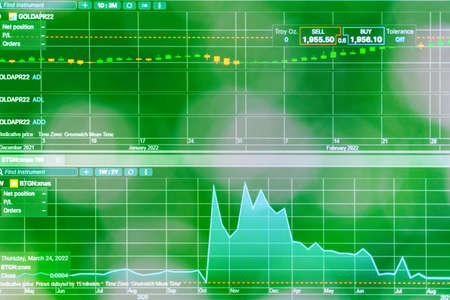
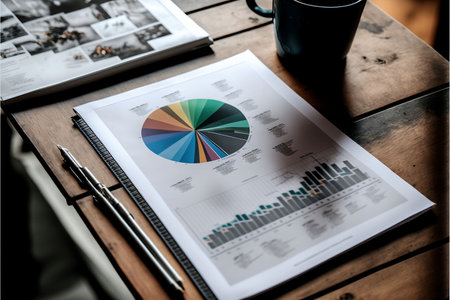
A close-up of a printed gold price chart with annotations and trend lines, placed on a desk with financial reports and a pen, emphasizing detailed market analysis.
Коллекция по умолчанию
Коллекция по умолчанию
Создать новую
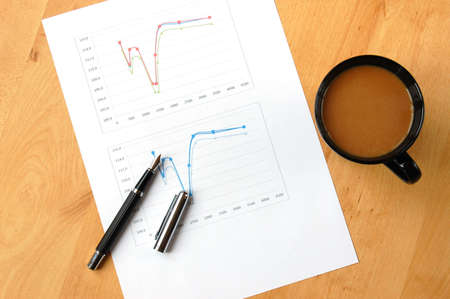
business still life with coffee and chart showing success
Коллекция по умолчанию
Коллекция по умолчанию
Создать новую
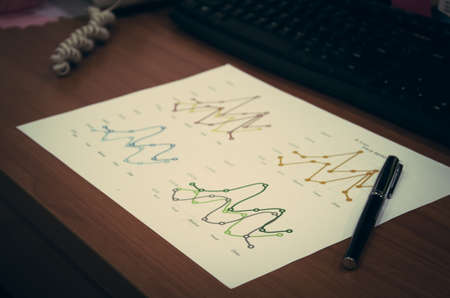
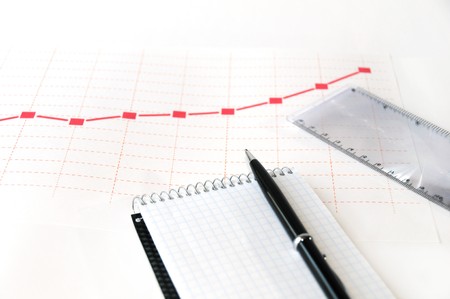
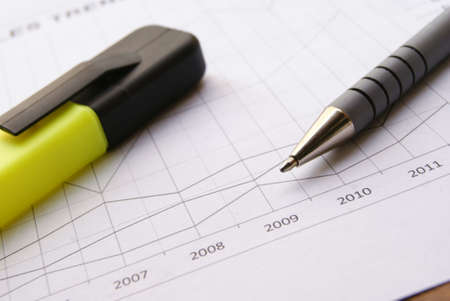
Line graph on desk and pen. Vintage filter
Коллекция по умолчанию
Коллекция по умолчанию
Создать новую
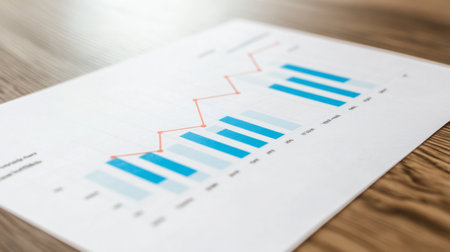
A business growth chart displayed on a wooden table represents data analysis and strategic planning. Ideal for finance and marketing themes.
Коллекция по умолчанию
Коллекция по умолчанию
Создать новую

ballpoint pen indicates income graphs lying on the table
Коллекция по умолчанию
Коллекция по умолчанию
Создать новую

image of the financial graph on a computer monitor.
Коллекция по умолчанию
Коллекция по умолчанию
Создать новую
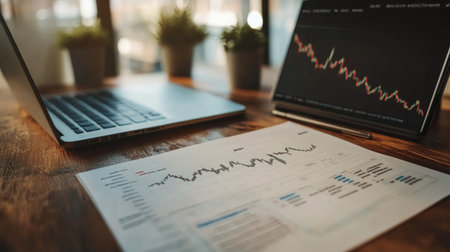
A close-up of a printed stock chart with annotations and handwritten notes, alongside a laptop and financial documents on a wooden desk.
Коллекция по умолчанию
Коллекция по умолчанию
Создать новую

Trader investor broker holding finger using cell phone app executing financial stock trade market trading order to buy or sell
Коллекция по умолчанию
Коллекция по умолчанию
Создать новую
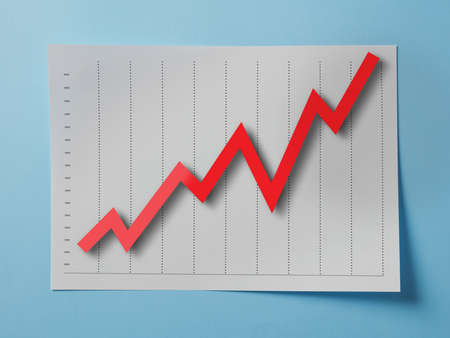
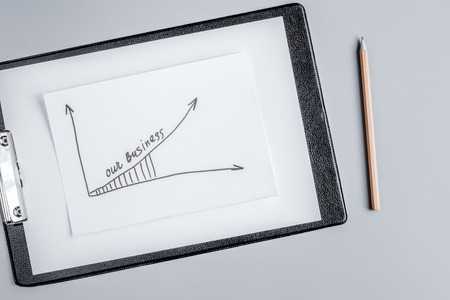
This close-up photograph showcases a single piece of paper placed on a table, Rising line graph showing business growth, AI Generated
Коллекция по умолчанию
Коллекция по умолчанию
Создать новую
businessman hand working with virtual chart business on touch screen computer as concept
Коллекция по умолчанию
Коллекция по умолчанию
Создать новую
Daily trading prices stock market graph showing on the screen.Daily investor's business everyday life.Selective focus.Telsiai,Lithuania.03-26-2022
Коллекция по умолчанию
Коллекция по умолчанию
Создать новую

Financial stock market graph. Stock Exchange. Selective focus.
Коллекция по умолчанию
Коллекция по умолчанию
Создать новую
Business reports
Коллекция по умолчанию
Коллекция по умолчанию
Создать новую

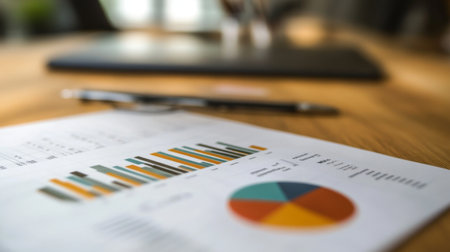
business analysis and statistics concept, desk with mixed graphs and charts on clipboard
Коллекция по умолчанию
Коллекция по умолчанию
Создать новую
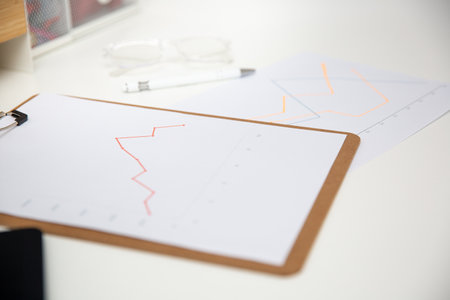
Office workplace table with charts report on wooden clipboard, glasses and pen.
Коллекция по умолчанию
Коллекция по умолчанию
Создать новую

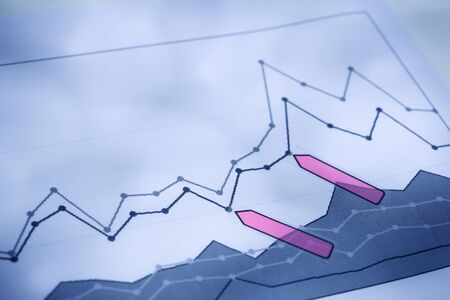
Colored sticker stripes on business analytics chart closeup
Коллекция по умолчанию
Коллекция по умолчанию
Создать новую
Stock market or forex trading graph and candlestick chart suitable for financial investment concept. Economy trends background for business idea and all art work design. Abstract finance background.
Коллекция по умолчанию
Коллекция по умолчанию
Создать новую
Graph drawn by hand on paper
Коллекция по умолчанию
Коллекция по умолчанию
Создать новую
An office worker shows his colleagues a presentation with a company development graph at night on the company's computer
Коллекция по умолчанию
Коллекция по умолчанию
Создать новую

Pebble towers on an open book against the backdrop of a graph of economic growth. Business Growth Concentration. Selective focus on stones.
Коллекция по умолчанию
Коллекция по умолчанию
Создать новую

Businessman plan and increase of positive indicators in his business.
Коллекция по умолчанию
Коллекция по умолчанию
Создать новую
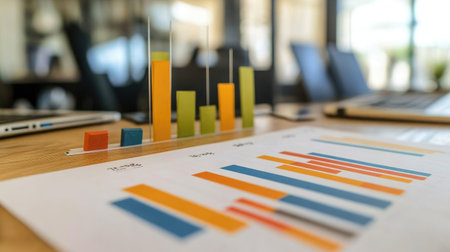
Vibrant bar graphs displayed on an office desk, showcasing business metrics and statistics. Ideal for content related to finance, analysis, and performance.
Коллекция по умолчанию
Коллекция по умолчанию
Создать новую

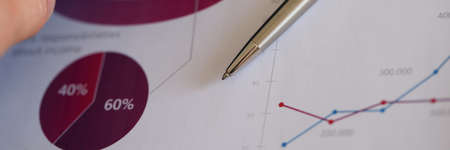
Fundamental and technical analysis concept.
Коллекция по умолчанию
Коллекция по умолчанию
Создать новую

A visually engaging workspace featuring colorful push pins and sticky notes on graph paper, illustrating data representation and enhancing creative organization for projects.
Коллекция по умолчанию
Коллекция по умолчанию
Создать новую
Two lines chart at comparision concept. Data analysis graph. Financial chart, analyzing report concept
Коллекция по умолчанию
Коллекция по умолчанию
Создать новую

Stock market candlestick chart, asset prices movement, currency exchange price action simple concept. Computer screen, display, candle chart, graph detail, extreme closeup, nobody, no people
Коллекция по умолчанию
Коллекция по умолчанию
Создать новую
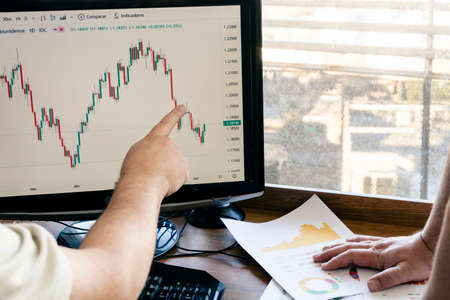
A stock investor shows another investor the behavior of a stock on the stock market on the monitor. Concept economy, stock market.
Коллекция по умолчанию
Коллекция по умолчанию
Создать новую

A curve growing upwards, resting on a yellow pencil on a gray background. The concept of business ideas and achievements.
Коллекция по умолчанию
Коллекция по умолчанию
Создать новую
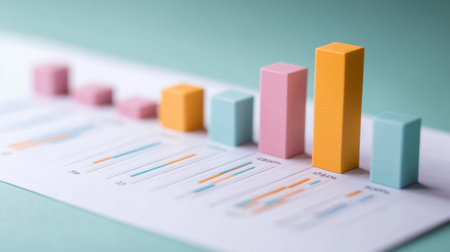
This image features a colorful bar graph on paper, showcasing pastel-colored bars that represent various data points, ideal for business and educational uses.
Коллекция по умолчанию
Коллекция по умолчанию
Создать новую

Hand of businessman looking documents report statistic financial with graph and chart and laptop computer and book on desk, finance and invest, digital marketing, business and communication concept.
Коллекция по умолчанию
Коллекция по умолчанию
Создать новую
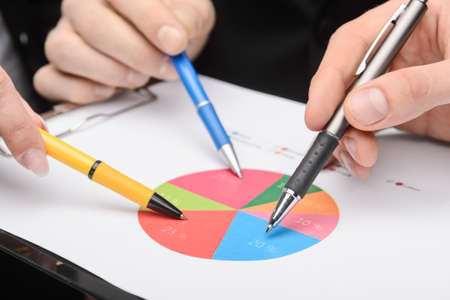
Image of several hands over business charts
Коллекция по умолчанию
Коллекция по умолчанию
Создать новую
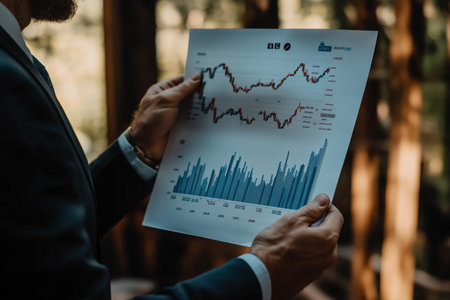
Business professional analyzing financial data in a forest setting during daylight hours
Коллекция по умолчанию
Коллекция по умолчанию
Создать новую
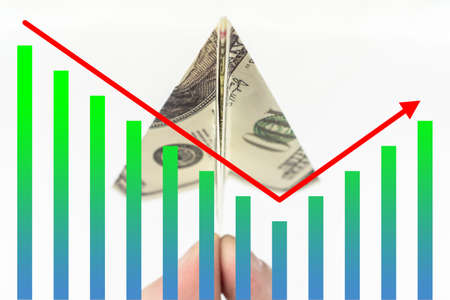
Airplane made of dollars as a symbol of economy. Rebound in finance. Concept-rebound after the collapse of the stock exchange. Graph symbolizes the restoration of the market. After the panic -growth
Коллекция по умолчанию
Коллекция по умолчанию
Создать новую

Stock market or forex trading graph in graphic concept suitable for financial investment or Economic trends business idea and all art work design.
Коллекция по умолчанию
Коллекция по умолчанию
Создать новую
Top view of business people and graphs and diagrams on floor
Коллекция по умолчанию
Коллекция по умолчанию
Создать новую
company strategy development management with graphic in business set on gray office desk background top view
Коллекция по умолчанию
Коллекция по умолчанию
Создать новую
A close-up of a line graph showing fluctuating trends, used to analyze market behavior or performance over time.
Коллекция по умолчанию
Коллекция по умолчанию
Создать новую
graphs and charts
Коллекция по умолчанию
Коллекция по умолчанию
Создать новую
The workplace of a businessman
Коллекция по умолчанию
Коллекция по умолчанию
Создать новую
A neat financial desk with live candlestick graphs, economic reports, and a coffee mug.
Коллекция по умолчанию
Коллекция по умолчанию
Создать новую
An AI generated illustration of project management graphs charts paper
Коллекция по умолчанию
Коллекция по умолчанию
Создать новую
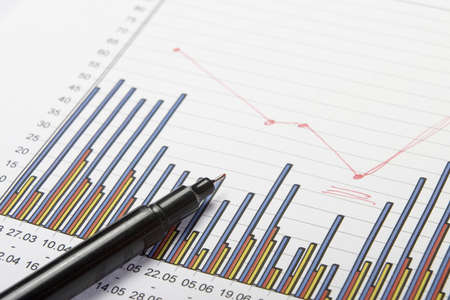
Photo of document & some graphics
Коллекция по умолчанию
Коллекция по умолчанию
Создать новую
Man putting ballpoint pen and documents with charts in leather bag closeup
Коллекция по умолчанию
Коллекция по умолчанию
Создать новую
Financial stock market graph. Stock Exchange. Selective focus.
Коллекция по умолчанию
Коллекция по умолчанию
Создать новую
graph paper showing business information, Business graph analysis concept
Коллекция по умолчанию
Коллекция по умолчанию
Создать новую
Indecision in the stock or crypto market. Price action going sideways before the next move. Economic growth or global recession.
Коллекция по умолчанию
Коллекция по умолчанию
Создать новую

Radiated emissions spectrogram with limit lines in EMC electromagnetic compatibility test report
Коллекция по умолчанию
Коллекция по умолчанию
Создать новую

This image features a colorful bar graph on paper, showcasing pastel-colored bars that represent various data points, ideal for business and educational uses.
Коллекция по умолчанию
Коллекция по умолчанию
Создать новую
Man hands with business chart, other accessories on table, blue diagram
Коллекция по умолчанию
Коллекция по умолчанию
Создать новую

closeup of red pin on financial graph, Business concept, target and win
Коллекция по умолчанию
Коллекция по умолчанию
Создать новую

Charts Graphs paper. Financial development, Banking Account, Statistics, Investment Analytic research data economy, Stock exchange Business office company meeting concept.
Коллекция по умолчанию
Коллекция по умолчанию
Создать новую
Shallow depth of field (selective focus) with details of a chart showing the stock market crash from March 2020 due to the Covid-19 pandemic on a computer screen (S&P500 index)
Коллекция по умолчанию
Коллекция по умолчанию
Создать новую
Businessman standing on a graph chart
Коллекция по умолчанию
Коллекция по умолчанию
Создать новую
Statistics reporting plan
Коллекция по умолчанию
Коллекция по умолчанию
Создать новую
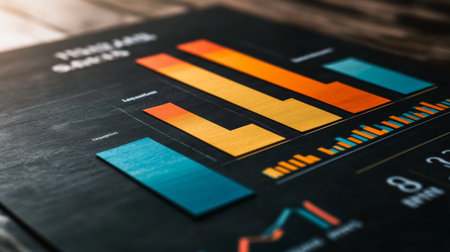
A vibrant bar chart displayed on a dark surface, showcasing data analysis and statistical trends, ideal for business presentations and reports.
Коллекция по умолчанию
Коллекция по умолчанию
Создать новую
Clean desk setup for strategic planning with annual growth projection
Коллекция по умолчанию
Коллекция по умолчанию
Создать новую
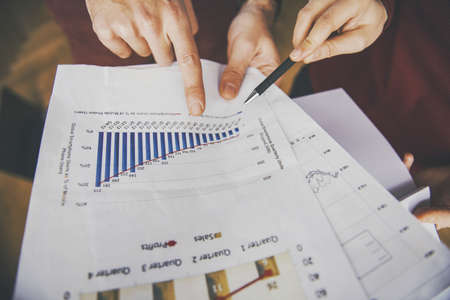
A close-up view of business analysis documents showcasing colorful graphs and charts on a wooden table, symbolizing data studies and insights.
Коллекция по умолчанию
Коллекция по умолчанию
Создать новую
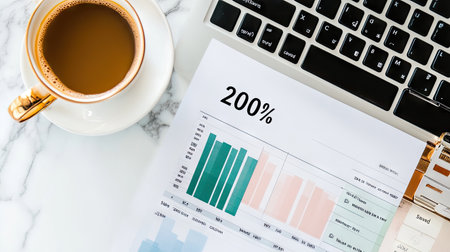
A modern workspace scene featuring a cup of coffee beside a laptop, with charts and graphs showcasing data analysis for productivity and business growth.
Коллекция по умолчанию
Коллекция по умолчанию
Создать новую
A warm-toned desk displaying financial dashboards next to economic printouts and coffee.
Коллекция по умолчанию
Коллекция по умолчанию
Создать новую

Business and Economy Theme. Trading Cryptocurrencies. Stock Market Candles Chart on Computer Display Close Up.
Коллекция по умолчанию
Коллекция по умолчанию
Создать новую
Business documents. Placed on the table with book
Коллекция по умолчанию
Коллекция по умолчанию
Создать новую

Business financial or stock market background. Business graph on stock market financial exchange
Коллекция по умолчанию
Коллекция по умолчанию
Создать новую
financial report with pen and calculator at the office
Коллекция по умолчанию
Коллекция по умолчанию
Создать новую
financial charts and graphs on the table of the businessman, business concept
Коллекция по умолчанию
Коллекция по умолчанию
Создать новую

Background of business graph
Коллекция по умолчанию
Коллекция по умолчанию
Создать новую

Candle stick graph chart of stock market investment trading. The Forex chart on the digital screen. Bar graphs, Diagrams, financial figures. Forex chart.
Коллекция по умолчанию
Коллекция по умолчанию
Создать новую

Indicators including volume analysis for professional technical analysis on the monitor of a computer. Fundamental and technical analysis concept.
Коллекция по умолчанию
Коллекция по умолчанию
Создать новую

Financial instruments with various types of indicators including volume analysis for professional technical analysis
Коллекция по умолчанию
Коллекция по умолчанию
Создать новую

Shallow depth of field (selective focus) with details of a candlestick chart on a computer screen.
Коллекция по умолчанию
Коллекция по умолчанию
Создать новую
Financial graphs analysis and pen.
Коллекция по умолчанию
Коллекция по умолчанию
Создать новую

Calculator, glasses, magnifier and pen with stock investment graph.
Коллекция по умолчанию
Коллекция по умолчанию
Создать новую
Business people during paperwork at meeting
Коллекция по умолчанию
Коллекция по умолчанию
Создать новую

A bar graph showing the company revenue growth or business growth and return on investment
Коллекция по умолчанию
Коллекция по умолчанию
Создать новую
Development and growth concept. Businessman plan growth and increase of positive indicators in his business.
Коллекция по умолчанию
Коллекция по умолчанию
Создать новую
Business chart with smart phone and pen
Коллекция по умолчанию
Коллекция по умолчанию
Создать новую
A visually appealing illustration of a dynamic financial chart with colorful lines representing growth trends, ideal for business and economic themes in presentations and reports.
Коллекция по умолчанию
Коллекция по умолчанию
Создать новую

graph of financial growth on a computer monitor.
Коллекция по умолчанию
Коллекция по умолчанию
Создать новую
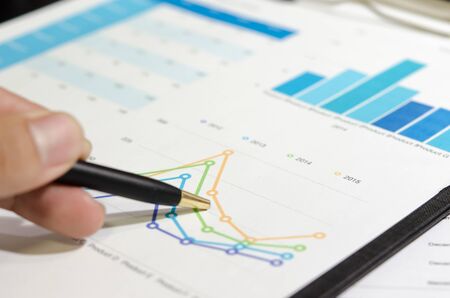
Chart and pen on the desk.
Коллекция по умолчанию
Коллекция по умолчанию
Создать новую

On table is tablet with commercial indicators of bank cards and banknotes
Коллекция по умолчанию
Коллекция по умолчанию
Создать новую
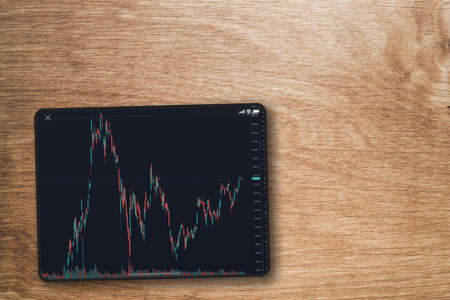
Financial stock market graph on the tablet screen on wooden background. Top view. Stock Exchange.
Коллекция по умолчанию
Коллекция по умолчанию
Создать новую

Financial graphs analysis and pen.
Коллекция по умолчанию
Коллекция по умолчанию
Создать новую
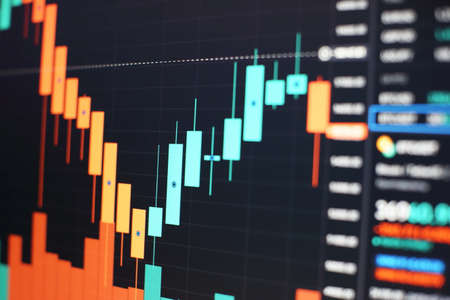
Stock exchange market chart background. Candle stick graph chart with indicator.
Коллекция по умолчанию
Коллекция по умолчанию
Создать новую
Pen and Highlighter on Financial Chart with positive growth pattern
Коллекция по умолчанию
Коллекция по умолчанию
Создать новую

A coffee cup beside colorful charts on a wooden table, perfect for depicting analysis, business meetings, and workspace environments. Ideal for marketing and financial themes.
Коллекция по умолчанию
Коллекция по умолчанию
Создать новую
Workplace on wooden table with graph papers
Коллекция по умолчанию
Коллекция по умолчанию
Создать новую
Legion-Media
Создайте свои проекты на основе качественных стоковых фотографий и видео.


Copyright © Legion-Media.